Ok, so you may remember this recent post, where I asked for interested people to send me pictures of as many flowers as they could photograph…
The premise is simple: How much variation is considered the ‘normal’ or ‘typical’ amount of variation for a species? How much is typical in terms of petal shape, size, and color for individuals in a given population of tuberous perennial Claytonia?! My collaborators and I have noticed quite a bit of variation among populations of different species, but what may be even more interesting is the amount of variation within populations. It might bend your brain the next time you kneel down and take a look around at the tuberous perennial Claytonia blooming in your area (right now!!!)… Better yet, take a picture of 50-100 different flowers from directly facing the flowers (trying to center the gynoecium in the flower as best as possible). Compare all your photos, or send them my way. We’ll get to the bottom of this!
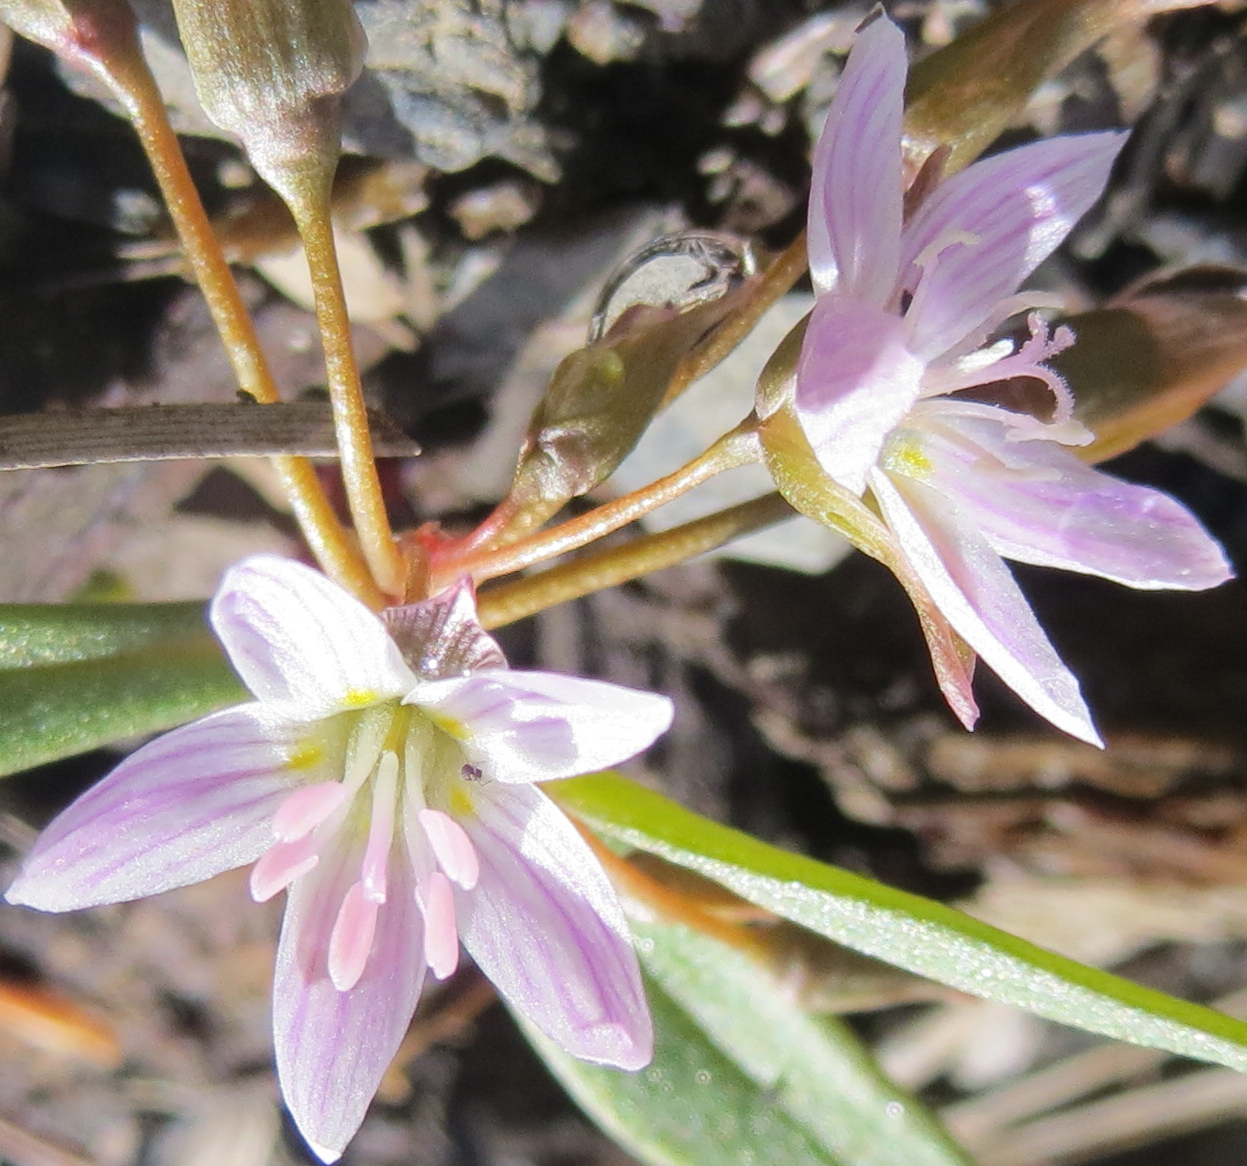
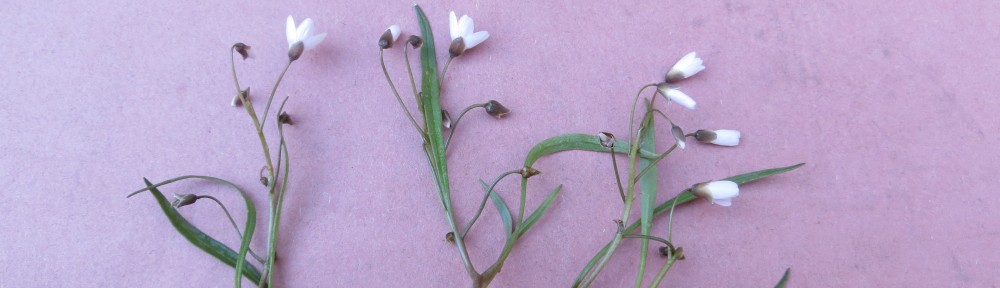
Enter stage left as ‘proof of concept’, a member of the C. “peirsonii” complex from the southern Sierra Nevada — all of the below pictures are from different flowering individuals within a single population, taken on the same day within about 45 minutes

 Note the visitors above: an ichneumonoid wasp (likely a parasitoid braconid) on the left, and a soft-winged flower beetle (Melyridae) on the right. We saw these same beetles last year, and I’ve also mentioned them in the ‘who’s pollinating Claytonia?‘ series — special thanks to Dr. Emile Fiesler for help with the identifications!
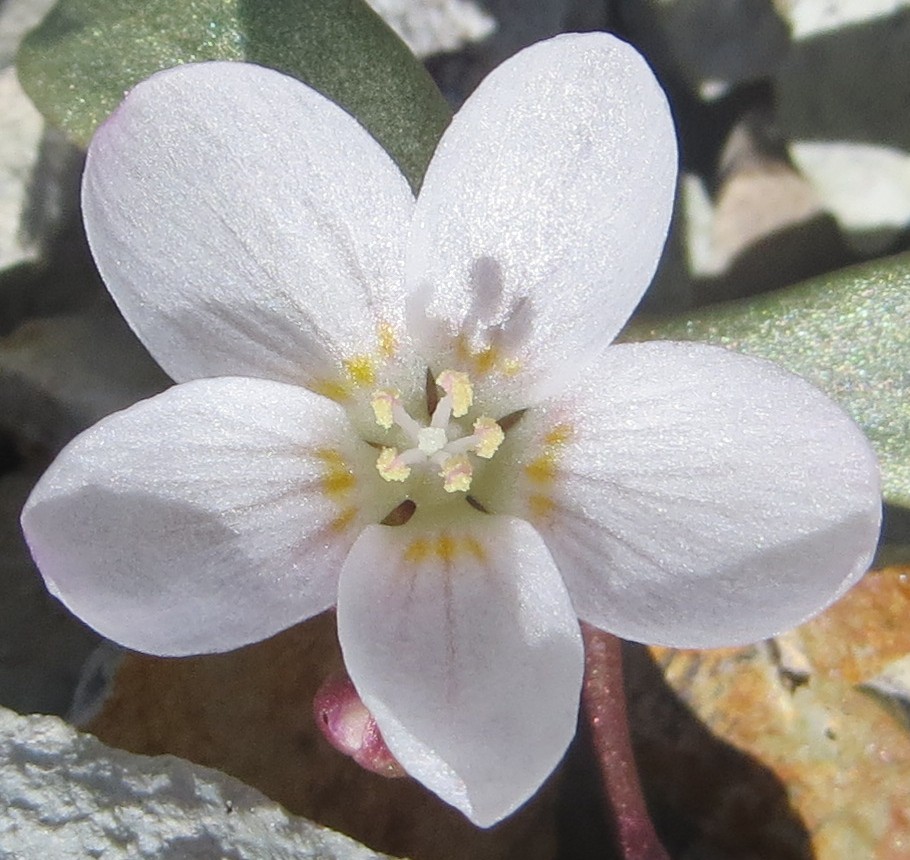


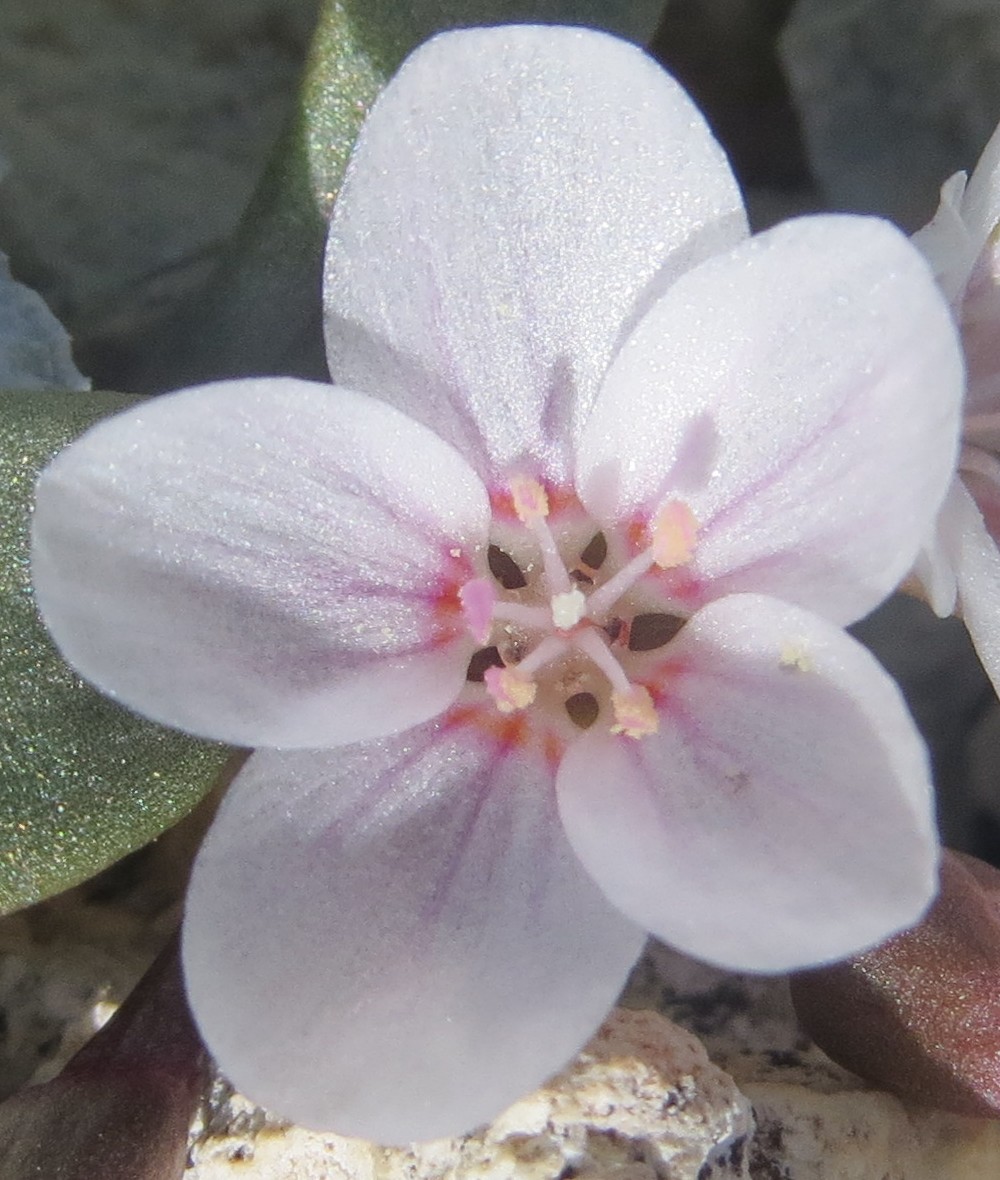
 The variation is crazy, right?!
 I really need to get a new ‘cutest Claytonia‘ contest going soon…